
M. T. AKBARI,1 S. S. PAPIHA,2 D. F. ROBERTS,3 AND D. D. FARHUD4
Received May 18, 1984; revised June 13, 1985.
American Journal of Human Genetics, 38:84-98, 1986
SUMMARY
From some 500 members of Christian communities in Iran (Armenians and Assyrians from six localities), blood specimens were obtained and examined for a number of blood group, red cell enzyme, and serum protein systems. The results indicate the relatively closed nature of the Christian community as a whole but that moderate differentiation has already occurred among the local groups. One factor in this diversification process that can be distinguished is the effect of urbanization in Tehran, but otherwise it seems to be largely random.
INTRODUCTION
Among the present-day ethnic composition of Iran, two Christian populations-the Armenians and the Assyrians-represent distinct religious minorities. These groups are widespread, with concentrations in various regions both in Iran and in the neighboring countries. Historically, there were movements of the Christian population under the pressure of Muslim and other invading groups, but due to their religious and cultural traditions, there has been little intermixture with other populations.
Genetic knowledge of the Iranian Armenians and Assyrians is limited to a few blood group systems [1-3]. Some of the systems studied demonstrated clear genetic differences between the Christians and the rest of the population of Iran. The known historical movement and settlement of these Christian groups in Iran provides an excellent background against which to study the genetic differentiation among their various regional subgroups. The present investigation of Iranian Christians therefore extends genetic information to include some of the systems that have not yet been studied and also examines the genetic differentiation and structure of the populations.
Armenians
The Armenians once occupied a large part of the area now known as Turkey, formerly the seat of the Hittite Empire. Their spread and contact with European civilization was promoted with the conquests of Alexander the Great when the Armenians became part of the newly formed Macedonian Empire. The Armenians accepted Christianity early, in 301 A.D. An influx of Armenians to Iran occurred in 1604 when Shah Abbas brought them as Christian captives from Jolfa (now in Soviet Armenia). Instead of being treated as slaves, they were encouraged to develop trade between east and west in Isfahan (then capital of Iran), which later intensified with the change of the capital to Tehran. According to the 1970 census of Iran, the Armenians were estimated at 200,000, living in four regions-Tehran, Isfahan, Tabriz, and Uromia.
Assyrians
The Assyrians are a group of Christians, also known as Nestorians, with a long history in the Middle East. From historical and archeological evidence, it is thought that their ancestors formed part of the Mesopotamian civilization. In the early part of this century, the Assyrians had to move into Iraq, where they were promised safety during World War I. A few years later, at the end of the war, most of them returned to Iran; some returned to Uromia, a rural settlement, their home area in Iran, but many went direct to Tehran where they formed their own urban community. In spite of these movements, the Assyrians kept themselves distinct socially.
Methods
From a total of 297 Armenians, blood samples were collected from Uromia, Tabriz, Isfahan, and Tehran (fig. 1). For Assyrians, 225 specimens were collected from Tehran and Uromia. Subjects were randomly selected, except that any close relatives were excluded. The blood grouping was performed in Tehran, and the plasma and red cell lysate samples were stored at -30°C until transported in dry ice to the Department of Human Genetics, Newcastle upon Tyne, where the electrophoretic studies were performed.
All specimens were tested with the following antisera: A, A1, B, C, Cw, c, D, E, e, S, s, P1, Lea, Lua, Lub, K, k, Fya, Fyb, and Jka. Red cell enzymes adenosine deaminase (ADA), esterase D (ESD), phosphoglucomutase I (PGM1), adenylate kinase (AK), 6-phosphogluconate dehydrogenase (6PGD), and acid phosphatase (AP) were examined according to the methods listed in [4]. The serum protein complement component (C3), haptoglobin (Hp), and transferrin (Tf) were examined by the methods standard in this laboratory [5]. The gene frequencies were calculated by maximum likelihood and gene counting methods. The F-statistics of Wright were calculated from the diallelic loci for which the heterozygote was discernible. FIT estimates were based on the heterozygote deficit or excess in the total population; FIS the mean of the estimate from the heterozygote excess over subpopulations; and FST from FIT and F1S.
RESULTS
The phenotype frequencies in Armenians from Uromia, Tabriz, Tehran, and Isfahan, and Assyrians from Tehran and Uromia are given in table I and gene frequencies in table 2. In no system was there any deviation from Hardy-Weinberg equilibrium.
MAP OF IRAN SHOWING THE SITE OF SAMPLE COLLECTION
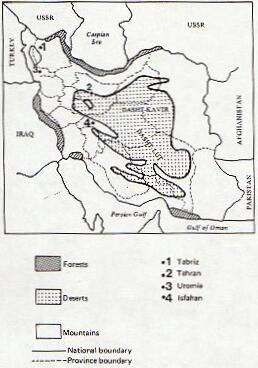
Fig 1.ùGeographical Location of Samples
Blood Groups
For the ABO system, the A gene frequency ranges in Armenians from 29% to 40% and in Assyrians from 26% to 33%. In neither Assyrians nor Armenians is there any regional genetic heterogeneity (X2 = 8.69, d.f. = 9, NS, and X2 = 6.41, d.f. = 3, NS, respectively), and there is no interethnic heterogeneity (X2 = 6.47, d.f. = 4, NS). The slightly lower frequencies of the AI gene in Armenians and Assyrians of Tehran (29% and 27%, respectively) by comparison with those in the original rural settlements of Uromia (differences are at the expense of O genes since the B gene frequency varies little) suggests some intermixing in Tehran with the local urban communities in whom the A gene frequency is lower (22%).
Table 1
Distribution of blood group antigens, serum proteins, and red cell enzymes among different regional groups of Armenian and Assyrian Christians in Iran (x2 tests deviation from Hardy-Weinberg equilibrium.
| |
ARMENIAN UROMIA |
ARMENIAN TABRIZ |
ARMENIAN TEHRAN |
ARMENIAN ISFAHAN |
ASSYRIAN TEHRAN |
ASSYRIAN
UROMIA |
||||||
| SYSTEM | No.
observed |
Frequency observed % |
No.
observed |
Frequency observed % |
No.
observed |
Frequency observed % |
No.
observed |
Frequency observed % |
No.
observed |
Frequency observed % |
No.
observed |
Frequency observed % |
| Blood groups: | |
|
|
|
|
|
|
|
|
|
|
|
| ABO: | |
|
|
|
|
|
|
|
|
|
|
|
| O |
11 |
15.9 |
13 |
20.0 |
28 |
33.3 |
22 |
27.8 |
24 |
31.6 |
29 |
19.5 |
| B |
7 |
10.1 |
6 |
9.2 |
10 |
11.9 |
7 |
8.9 |
15 |
19.7 |
22 |
14.8 |
| A2 |
5 |
7.2 |
3 |
4.6 |
3 |
3.6 |
7 |
8.9 |
1 |
1.3 |
14 |
9.4 |
| A1 |
38 |
55.1 |
36 |
55.4 |
37 |
44.0 |
36 |
45.6 |
32 |
42.1 |
75 |
50.3 |
| A1B |
2 |
2.9 |
3 |
4.6 |
1 |
1.2 |
1 |
1.3 |
1 |
1.3 |
2 |
1.3 |
| A2B |
6 |
8.7 |
4 |
6.2 |
5 |
6.0 |
6 |
7.5 |
3 |
3.9 |
7 |
4.7 |
| Total |
69 |
... |
65 |
... |
84 |
... |
79 |
... |
76 |
... |
149 |
... |
| X22 | |
0.29 |
|
4.54 |
|
.39 |
|
0.72 |
|
2.86 |
|
3.57 |
| Rhesus: | |
|
|
|
|
|
|
|
|
|
|
|
| ccddee |
8 |
11.6 |
3 |
4.6 |
10 |
11.9 |
6 |
7.6 |
8 |
8.7 |
11 |
7.4 |
| ccdaEE |
1 |
1.4 |
... |
... |
... |
... |
... |
... |
... |
... |
1 |
0.7 |
| ccddEE |
1 |
1.4 |
... |
... |
... |
... |
... |
... |
... |
... |
... |
... |
| ccDee |
3 |
4.3 |
6 |
9.2 |
6 |
7.1 |
3 |
3.8 |
5 |
5.4 |
9 |
6.0 |
| ccDEe |
2 |
2.9 |
5 |
7.7 |
8 |
9.5 |
13 |
16.4 |
15 |
16.3 |
17 |
11.4 |
| ccDEE |
2 |
2.9 |
1 |
1.0 |
4 |
4.8 |
2 |
2.5 |
... |
... |
7 |
4.7 |
| Ccddee |
3 |
4.3 |
2 |
3.1 |
1 |
1.2 |
1 |
1.3 |
2 |
2.2 |
5 |
3.3 |
| CcDee |
23 |
33.3 |
23 |
35.4 |
31 |
36.9 |
32 |
40.5 |
24 |
26.1 |
43 |
28.9 |
| CcDEe |
6 |
8.7 |
11 |
16.9 |
12 |
14.3 |
12 |
15.2 |
10 |
10.9 |
10 |
6.7 |
| CcDEE | ... | ... |
1 |
1.5 |
... |
... |
... |
... |
... |
... |
1 |
0.7 |
| Ccddee |
1 |
1.5 |
... | ... | ... | ... |
1 |
1.3 |
... |
... |
5 |
3.3 |
| CCDee |
13 |
18.8 |
13 |
20.0 |
11 |
13.1 |
9 |
11.4 |
27 |
29.3 |
36 |
24.2 |
| CCDEE |
... |
... |
... |
... |
... |
... |
|
... |
... |
... |
... |
... |
| CCDEe |
3 |
4.4 |
... |
... |
1 |
1.2 |
... |
... |
. . . | ... |
1 |
0.7 |
| CWCDee |
1 |
1.5 |
... |
... |
... |
... |
.. . |
... |
|
... |
... |
... |
| CWcDee |
1 |
1.5 |
... |
... |
... |
... |
... |
... |
... |
... |
... |
|
| CWcdee |
1 |
1.5 |
... |
... |
... |
... |
... |
... |
... |
... |
... |
... |
| Total |
69 |
... |
65 |
... |
84 |
... |
79 |
... |
92 |
... |
149 |
... |
| X24 | |
0.219 |
|
0.776 |
|
0.876 |
|
4.5 |
|
4.55 |
|
7.48 |
| Ss: | |
|
|
|
|
|
|
|
|
|
|
|
| SS |
7 |
10.0 |
13 |
20.3 |
18 |
21.4 |
13 |
16.4 |
19 |
120.6 |
23 |
15.4 |
| Ss |
11 |
16.0 |
26 |
40.6 |
26 |
30.9 |
20 |
2~.3 |
30 |
32.6 |
33 |
22.1 |
| SS |
50 |
72.5 |
24 |
37.5 |
40 |
47.7 |
42 |
53.2 |
43 |
46.8 |
92 |
61.8 |
| S-s- |
1 |
1.5 |
1 |
1.6 |
... |
... |
4 |
5.1 |
|
... |
1 |
0.7 |
| |
|
|
|
|
|
|
|
|
|
|
|
Y |
| Total |
69 |
... |
64 |
... |
84 |
... |
79 |
... |
92 |
... |
149 |
... |
| |
0.77 |
... |
0.11 |
... |
2.63 |
... |
0.0 |
... |
2.25 |
... |
2.40 |
|
| P1+ |
32 |
46.3 |
27 |
41.5 |
40 |
47.6 |
44 |
56.4 |
54 |
58.7 |
76 |
51.0 |
| P1- |
37 |
53.7 |
38 |
58.5 |
44 |
52.4 |
34 |
43.6 |
38 |
41.3 |
73 |
49.0 |
| Total |
69 |
... |
65 |
... |
84 |
... |
78 |
... |
92 |
... |
149 |
|
| Duffy: | |
|
|
|
|
|
|
|
|
|
|
|
| Fya+b- |
22 |
31.9 |
18 |
18.1 |
19 |
2.6 |
20 |
25.3 |
22 |
25.3 |
41 |
27.5 |
| Fya+b+ |
24 |
34.8 |
29 |
45.3 |
42 |
50.0 |
36 |
45.6 |
41 |
47.1 |
68 |
45.6 |
| Fya-b+ |
22 |
31.9 |
15 |
23.4 |
22 |
26.2 |
20 |
25.3 |
24 |
27.6 |
39 |
26.2 |
| Fya-b- |
1 |
1.4 |
2 |
3.1 |
1 |
1.2 |
3 |
3.8 |
... |
... |
1 |
0.7 |
| Total |
69 |
... |
64 |
... |
84 |
... |
79 |
... |
87 |
... |
149 |
... |
| X21 |
0.2 |
... |
2.66 |
... |
2.72 |
... |
4.42 |
... |
0.06 |
... |
0.47 |
|
| Lewis: | |
|
|
|
|
|
|
|
|
|
|
|
| Lea+ |
11 |
15.9 |
... |
... |
21 |
26.9 |
... |
... |
13 |
23.2 |
37 |
24.8 |
| Lea- |
58 |
84.1 |
... |
... |
57 |
73.1 |
... |
... |
43 |
76.8 |
112 |
75.2 |
| Total |
69 |
... |
... |
... |
78 |
... |
|
... |
56 |
... |
149 |
... |
| Lutheran: | |
|
|
|
|
|
|
|
|
|
|
|
| Lua+b- |
... |
... |
... |
... |
... |
... |
1 |
1.3 |
... |
... |
... |
... |
| Lua+b+ |
1 |
1.4 |
5 |
7.8 |
7 |
8.3 |
2 |
2.5 |
4 |
4.5 |
4 |
2.7 |
| Lua-b+ |
68 |
98.6 |
59 |
92.2 |
77 |
91.7 |
76 |
96.5 |
85 |
95.5 |
145 |
97.3 |
| Total |
69 |
... |
64 |
... |
84 |
... |
79 |
... |
89 |
... |
149 |
... |
| Kell: | |
|
|
|
|
|
|
|
|
|
|
' |
| KK | ... | ... | I |
1.6 |
... |
... |
... |
... |
... |
... |
... |
... |
| Kk |
6 |
8.7 |
4 |
6.2 |
5 |
5.9 |
7 |
8.7 |
10 |
10.9 |
12 |
8.0 |
| Kk |
63 |
91.3 |
59 |
92.2 |
79 |
94.1 |
72 |
91.3 |
82 |
89.1 |
137 |
92.0 |
| Total |
69 |
|
64 |
... |
84 |
... |
79- |
|
92 |
... |
149 |
... |
| X21 | ... |
0.15 |
... |
0.13 |
... |
0.08 |
... |
0.17 |
... |
0.30 |
... |
0.26 |
| Kidd: | |
|
|
|
|
|
|
|
|
|
|
|
| Jk(a+) |
43 |
62.3 |
51 |
79.7 |
58 |
29.0 |
54 |
68.3 |
25 |
80.6 |
99 |
66.4 |
| Jk(a-) |
26 |
37.7 |
13 |
20.3 |
26 |
31.0 |
25 . |
31.7 |
6 |
19.3 |
50 |
33.6 |
| Total |
69 |
... |
64 |
... |
84 |
... |
79 |
... |
31 |
.. |
149 |
... |
| Serum proteins: | |
|
|
|
|
|
|
|
|
|
|
|
| HP: | |
|
|
|
|
|
|
|
|
|
|
|
| 1-1 |
6 |
9.7 |
5 |
8.1 |
5 |
6.7 |
9 |
12.0 |
4 |
4.4 |
8 |
5.6 |
| 2-1 |
24 |
38.7 |
25 |
40.3 |
34 |
45.3 |
29 |
38.7 |
31 |
34.5 |
54 |
38.0 |
| 2-2 |
32 |
51.6 |
32 |
51.6 |
36 |
48.0 |
37 |
49.3 |
55 |
61.1 |
80 |
56.4 |
| Total |
69 |
... |
62 |
... |
75 |
... |
75 |
... |
90 |
... |
142 |
... |
| X21 | ... |
0.22 |
... |
0.0 |
... |
0.87 |
... |
0.77 |
... |
0.02 |
... |
0.08 |
| |
|
|
|
|
|
|
|
|
|
|
|
|
| C3: | |
|
|
|
|
|
|
|
|
|
|
|
| SS |
46 |
76.6 |
45 |
75.0 |
52 |
65.8 |
49 |
72.0 |
65 |
73.0 |
82 |
70.1 |
| SF |
13 |
21.7 |
15 |
25.0 |
24 |
30.4 |
17 |
25.0 |
19 |
21.4 |
32 |
27.3 |
| FF |
1 |
1.6 |
... |
... |
3 |
3.8 |
2 |
3.0 |
5 |
5.6 |
3 |
2.6 |
| Total |
60 |
... |
60 |
... |
79 |
... |
68 |
... |
89 |
... |
117 |
... |
| X21 |
... |
0.0 |
... |
1.6 |
... |
0.01 |
... |
0.12 |
... |
0.01 |
... |
0.0 |
| Tf: | |
|
|
|
|
|
|
|
|
|
|
|
| TfC |
62 |
100.0 |
62 |
100.0 |
75 |
100.0 |
75 |
100.0 |
90 |
100.0 |
141 |
99.3 |
| TfCB |
... |
0.0 |
... |
0.0 |
... |
0.0 |
... |
0.0 |
... |
... |
1 |
0.7 |
| Total |
62 |
... |
62 |
... |
75 |
... |
75 |
... |
90 |
... |
142 |
... |
| Red cell enzymes: | |
|
|
|
|
|
|
|
|
|
y. | |
| ADA: | |
|
|
|
|
|
|
|
|
|
,. |
|
| 1-1 |
50 |
89.3 |
38 |
80.8 |
54 |
77.1 |
44 |
70.0 |
61 |
79.2 |
l00 |
73.5 |
| 2-1 |
6 |
10.7 |
9 |
19.2 |
15 |
21.4 |
17 |
26.9 |
13 |
16.9 |
33 |
24.3 |
| 2-2 | ... | ... |
... |
... |
1 |
1.5 |
2 |
3.1 |
3 |
3.9 |
3 |
2.2 |
| Total |
56 |
... |
47 |
... |
70 |
|
63 |
... |
77 |
... |
136 |
... |
| X21 | ... |
0.18 |
. . . |
0.52 |
... |
0.0 |
... |
0.05 |
... |
0.19 |
... |
0.02 |
| ESD: | |
|
|
|
|
|
|
|
|
|
|
|
| 1-1 |
41 |
73.2 |
45 |
70.3 |
58 |
78.4 |
53 |
80.3 |
58 |
78.4 |
87 |
61.7 |
| 2-1 |
13 |
23.2 |
16 |
25.0 |
13 |
17.6 |
13 |
19.7 |
13 |
17.5 |
49 |
34.7 |
| 2-2 |
2 |
3.6 |
3 |
4.7 |
3 |
4.0 |
0 |
... |
3 |
4.1 |
5 |
3.6 |
| Total |
56 |
... |
64 |
... |
74 |
... |
66 |
... |
74 |
... |
141 |
... |
| X21 | ... |
0.04 |
... |
0.09 |
... |
0.16 |
... |
0.04 |
... |
0.22 |
... |
0.35 |
| PGM1: | |
|
|
|
|
|
|
|
|
|
|
|
| 1-1 |
20 |
40.8 |
16 |
42.1 |
28 |
39.3 |
39 |
57.3 |
46 |
34.1 |
53 |
37.3 |
| 2-1 |
21 |
42.9 |
14 |
36.8 |
37 |
50.7 |
21 |
30.9 |
29 |
34.1 |
66 |
46.5 |
| 2-2 |
8 |
16..3 |
8 |
4.1 |
8 |
11.0 |
8 |
11.8 |
10 |
11.8 |
23 |
16.2 |
| Total |
49 |
... |
38 |
... |
73 |
... |
68 |
... |
85 |
... |
142 |
... |
| X21 | ... |
0.38 |
... |
2.0 |
... |
0.77 |
... |
3.3 |
. |
2.41 |
... |
0.10 |
| AK: | |
|
|
|
|
|
|
. |
|
|
|
|
| 1-1 |
46 |
86.8 |
58 |
90.6 |
78 |
97.5 |
68 |
97.1 |
71 |
80.7 |
126 |
93.3 |
| 2-1 |
7 |
13.2 |
6 |
9.4 |
2 |
2.5 |
2 |
2.9 |
17 |
19.3 |
9 |
6.7 |
| Total |
53 |
... |
64 |
... |
80 |
... |
70 |
.. |
88 |
... |
135 |
... |
| X21 | |
0.263 |
... |
0.154 |
... |
0.01 |
... |
0.01 |
... |
1.00 |
... |
0.16 |
| 6PGD: | |
|
|
|
|
|
|
|
|
|
|
|
| AA |
47 |
94.0 |
58 |
98.3 |
69 |
100.0 |
61 |
96.8 |
71 |
92.2 |
110 |
92.4 |
| AC |
3 |
6.0 |
1 |
1.7 |
... |
... |
2 |
3.2 |
6 |
7.8 |
9 |
7.6 |
| Total |
50 |
... |
59 |
... |
69 |
|
63 |
... |
77 |
... |
119 |
... |
| X21 | ... |
0.0 |
... |
0.0 |
... |
0.0 |
... |
0.02 |
... |
0.13 |
... |
0.18 |
| AP: | |
|
|
|
|
|
|
|
|
|
|
|
| A |
2 |
5.3 |
2 |
6.5 |
5 |
10.0 |
3 |
6.4 |
4 |
..5 |
8 |
6.5 |
| BA |
14 |
36.8 |
9 |
29.0 |
15 |
30.0 |
9 |
19.1 |
26 |
29.5 |
28 |
22.8 |
| B |
18 |
47.4 |
19 |
61.3 |
22 |
44.0 |
26 |
55.3 |
58 |
66.0 |
81 |
65.8 |
| CB |
2 |
5.3 |
1 |
3.2 |
2 |
4.0 |
6 |
12.8 |
... |
... |
6 |
4.9 |
| CA |
1 |
2.6 |
... |
... |
3 |
6.0 |
3 |
6.4 |
... |
... |
... |
... |
| C |
1 |
2.6 |
... |
... |
3 |
6.0 |
|
... |
... |
... |
... |
... |
| Total |
38 |
... |
31 |
... |
50 |
... |
47 |
... |
88 |
... |
123 |
... |
| X21 | ... |
1.68 |
... |
0.70 |
... |
3.48 |
... |
2.52 |
... |
0.24 |
... |
3 .42 |
Table 2
Gene Frequencies For Armenian and Assyrian Populations in Iran
| Gene | Armenian Uromia |
Armenian Tabriz |
Armenian Tehran |
Armenian Isfahan |
Assyrian Tehran |
Assyrian Uromia |
| |
|
|
|
|
|
|
| p |
.399 |
.383 |
.293 |
.314 |
.269 |
.333 |
| p2 |
.091 |
.079 |
.034 |
.077 |
.019 |
.088 |
| q |
.115 |
.105 |
.100 |
.092 |
.135 |
.119 |
| r |
.395 |
.433 |
.573 |
.517 |
.577 |
.460 |
| CDe |
.378 |
.417 |
.378 |
.369 |
.452 |
.352 |
| cDE |
.051 |
.140 |
.162 |
.184 |
.133 |
.128 |
| cde |
.333 |
.221 |
.343 |
.321 |
.289 |
.249 |
| Cde |
.075 |
.054 |
.015 |
.042 |
.040 |
.122 |
| cdE |
.048 |
... |
... |
... |
... |
... |
| CDE |
.032 |
.014 |
.011 |
... |
.008 |
.014 |
| CdE |
... |
... |
... |
... |
... |
.009 |
| cDe |
.061 |
.154 |
.091 |
.084 |
.078 |
.109 |
| CwDe |
.010 |
... |
... |
... |
... |
... |
| Cwde |
.012 |
... |
... |
... |
... |
.. |
| S |
.145 |
.368 |
.326 |
.237 |
.331 |
.220 |
| s |
.684 |
.523 |
.564 |
.537 |
.570 |
.627 |
| Su |
.171 |
.109 |
.110 |
.226 |
.099 |
.153 |
| P1+ |
.268 |
.235 |
.276 |
.340 |
.357 |
.300 |
| P2+ P |
.732 |
.765 |
.724 |
.660 |
.643 |
.700 |
| Lua |
.007 |
.039 |
.042 |
.025 |
.023 |
.013 |
| Lub |
.993 |
.961 |
.958 |
.975 |
.977 |
.987 |
| K |
.043 |
.047 |
023 |
.044 |
.054 |
.040 |
| k |
.957 |
.953 |
.977 |
.956 |
.946 |
.960 |
| Fya |
.430 |
.458 |
.451 |
.432 |
.479 |
.473 |
| Fvb |
.430 |
.417 |
.484 |
.432 |
.501 |
.461 |
| Fy |
.140 |
.125 |
.065 |
.136 |
.020 |
.066 |
| Jka |
.386 |
.549 |
.444 |
.438 |
.560 |
.421 |
| Jkb |
.613 |
.451 |
.556 |
.562 |
.440 |
.579 |
| Hp1 |
.290 |
.282 |
.293 |
.313 |
.217 |
.246 |
| Hp2 |
.710 |
.718 |
.707 |
.687 |
.783 |
.754 |
| C3s |
.875 |
.875 |
.810 |
.846 |
.837 |
.838 |
| C3F |
.125 |
.125 |
.190 |
.154 |
.163 |
.162 |
| Tfc |
1.00 |
1.00 |
1.00 |
1.00 |
1.00 |
.996 |
| TfB |
... |
... |
... |
... |
... |
.004 |
| ADA1 |
.946 |
.904 |
.879 |
.833 |
.877 |
.857 |
| ADA2 |
.054 |
.096 |
.121 |
.167 |
.123 |
.143 |
| ESD1 |
.848 |
.828 |
.872 |
.902 |
.872 |
.791 |
| ESD2 |
.152 |
.172 |
.128 |
.098 |
.428 |
.209 |
| PGM11 |
.622 |
.605 |
.637 |
.728 |
.712 |
.606 |
| PGM12 |
.377 |
.395 |
.363 |
372 |
.283 |
.394 |
| AK1 |
.934 |
.953 |
.987 |
.986 |
.903 |
.967 |
| AK2 |
.066 |
.047 |
.013 |
.014 |
.097 |
.033 |
| 6PGDA |
.970 |
.991 |
1.00 |
.984 |
.961 |
.962 |
| 6PGDc |
.030 |
.009 |
.00 |
.016 |
.039 |
.038 |
| APa |
.250 |
.210 |
.280 |
.191 |
.193 |
.179 |
| APb |
.684 |
.774 |
.610 |
.713 |
.807 |
.790 |
| APc |
.066 |
.016 |
.110 |
.096 |
... |
.024 |
| LDHN |
1.00 |
1.00 |
1.00 |
1.00 |
1.00 |
1.00 |
| MDHN |
1.00 |
1.00 |
1.00 |
1.00 |
1.00 |
1.00 |
| SOD1 |
1.00 |
1.00 |
1.00 |
1.00 |
1.00 |
1.00 |
In the Rh system, there is significant regional genetic heterogeneity among all six communities (X2 = 15.2, d.f. = 4, P < .01) but not within Armenians or Assyrians (X2 = 11.0, d.f. = 12, NS, and X2 = 2.3, d.f. = 4, NS, respectively) or between the two Christian groups (X2 = 28.04, d.f. = 20, NS). The most common haplotypes encountered in these two populations are CDe (range 34%-45%) and cde (range 22%-34%). The Armenians of Uromia were, however, characterized by a low frequency of cDE and the presence of cdE, CwDe, and Cwde haplotypes.
For the MNSs system, the anti-M and anti-N sera deteriorated during transport and could not be relied on, so only the Ss results are presented. The Armenians and Assyrians of Uromia showed the lowest frequency of the S gene (15% and 22%, respectively), and there was significant heterogeneity within the former (X2 = 18.76, d.f. = 6, P < .01). In four of the six regional populations, there were individuals showing the S-s- phenotype, giving the rather high Su gene frequencies ranging from 11% to 23%, slightly higher on average in the Armenians than in the Assyrians. There was no genetic heterogeneity in the P, Lutheran, and Kell systems.
For the Duffy system, this is the first investigation in which both anti-Fya and anti-Fyb were used. The Duffy gene frequencies in the six groups are similar. The Fy gene is present, its frequency being higher in the Armenians than in the Assyrians. The Kidd frequencies show a slightly wider range, the Uromia samples tending to have slightly lower Jka frequencies in each population.
Serum Proteins
The large number of studies of the haptoglobin system in Iran show the overall frequency range of the Hpl gene to be 20%-36% [6, 7], into which the present frequencies in the Armenians and Assyrians fit well. For transferrin, only one Assyrian of Uromia showed the phenotype BC. The C3 system has been little studied in Iran, the sole report of the C3*F allele frequency for Iranians being 21% [8]. There is no significant heterogeneity among the six groups in this investigation, the C3*F frequency in Assyrians and Armenians ranging from 13% to 19%.
Red Cell Enzymes
For the ADA, ESD, and PGM, systems, the six samples of Assyrians and Armenians showed no significant regional or ethnic heterogeneity. The 6PGDc gene is missing in Armenians of Tehran and at very low frequency in Armenians of Tabriz, but is at quite a high frequency (4%) in both Assyrian groups. This frequency variation of the PGDc gene within Armenians and between Armenians and Assyrians is statistically significant (X2 = 8.58, d.f. = 3, P < .05, and X2 = 8.27, d.f. = 1, P < .01). In Armenians, the AK2 gene frequency ranges to a significant extent (X2 = 8.58, d.f. = 3, P < .05) from 1% to 7%, but the two Assyrian samples differ significantly from each other (X2 = 7.10, P < .01). For acid phosphatase, again there is significant regional heterogeneity (X2 = 20.50; d.f. = 3, P < .001). There is no genetic variation in the LDH, MDH, and SOD systems.
TABLE 3
ESTIMATES OF F-STATISTICS AMONG SIX ARMENIAN AND ASSYRIAN GROUPS (IRANIAN CHRISTIANS)
| |
|
|
Unweighted FIS | Weighted FIS | FST | |||
| SYSTEM | FIT ... | X2 | Average | Variance | Average | Variance | Unweighted | Weighted |
| Lutheran | .0579 | 1.79 |
.0598 |
.0366 |
.0517 |
.0330 |
-.0020 |
.0065 |
| Kell |
.0006 |
.00 |
.0131 |
.0165 |
-.0031 |
.0125 |
-.0125 |
.0037 |
| Rh(Cc) |
.0334 |
.60 | -.0037 |
.0212 |
.0251 |
.0216 |
.0370 |
.0084 |
| Rh(Ee) | .1791 |
17.58 |
.1370 |
.0592 |
.1500 |
.0556 |
.0487 |
.0342 |
| Hp |
.0072 |
.02 |
.0058 |
.0038 |
-.0000 |
.0034 |
.0014 |
.0073 |
| C3 |
.0388 |
.71 |
.0222 |
.0111 |
.0308 |
.0108 |
.0168 |
.71 |
| ADA |
.0439 |
.86 |
.0155 |
.0103 |
.0265 |
.0092 |
.0288 |
.0179 |
| ESD | .0686 |
2.24 |
.0817 |
.0152 |
.0649 |
.0157 |
-.0142 |
.0040 |
| 6PGD | -.0293 |
.31 |
-.0270 |
.0001 |
-.0295 |
.0001 |
-.0022 |
.0001 |
| PGM | .0912 |
3.78 |
.1061 |
.0132 |
.0860 |
.0120 |
-.0167 |
.0056 |
| AK | -.0458 |
1.03 |
-.0480 |
.0010 |
-.0469 |
.0010 |
.0020 |
.0009 |
| Mean | .0405 | ... |
.0329 |
... |
.0323 |
... |
.00792 |
.0088 |
Population Structure
To the phenotype and gene frequency findings on these populations may be applied Wright's [9, 10] F statistics. In the majority of genetic systems where the heterozygote is phenotypically distinguishable, the estimates are low positive and the mean FIT, FIS, and FST are all positive (table 3). The FIT estimate measuring the inbreeding coefficient of an individual relative to the total population of Christians indicates a clear tendency to excess homozygosity, on average some two-thirds that of offspring of first-cousin unions, reflecting the breeding isolation of the Christians as a whole. However, the mean FIS estimate, the coefficient of an individual relative to the subgroup to which he belongs, is nearly as high. This may be a reflection of the small size or relatively closed nature of these local communities or of some practice within them tending to promote consanguineous marriages; the former seems the more likely. Certainly the mean FST value, measuring the differentiation of subpopulations, is not high, and suggests that the extent of random genetic differentiation among these subpopulations is so far only moderate.
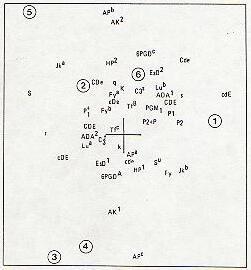
The R matrix of Harpending and Jenkins [11], measuring kinship among the six populations (table 4), uses all the available genetic systems. The elements on its principal diagonal show that the Armenian populations of Tabriz and Isfahan, and the Assyrians from Uromia, are closest to the center of the population cluster, while the Armenians from Uromia and the two samples from Tehran are the most peripheral. The value of RST calculated from the principal diagonal is 0.0117, slightly higher than Wright's FST. This difference may well be due to the addition of further systems in the calculation of the R matrix, but the conclusion that the effect of random subpopulation differentiation is only moderate remains unchanged. The elements rid show that the: most closely related pairs are the Armenians from Isfahan and Tehran, followed by the Armenians and Assyrians from Uromia. The least closely related are the Armenians of Uromia to the two Tehran groups. The distance measures calculated from the R matrix (table 5) show the same pattern.
The contribution of particular alleles to this pattern of relationships can be summarized by plotting (fig. 2) the first two eigenvectors of the R matrix superimposed on the S matrix [11]. The position of the Armenians of Uromia is associated particularly with alleles cdE, Jkb, and P,; the Armenians of Tehran and Isfahan with Apc and AK1; and the Tehran Assyrians with S, Jka, APb, and AK2. Although there is a suggestion of some contribution of African genes (Su, Fy) particularly to the Armenians, the fact that none of these or other African alleles are situated at peripheral positions and none is particularly characteris tic of any of the six populations suggests that the heterogeneity of the Christian groups owes little to such admixture. In the absence of any other identifiable contributory source, a reasonable interpretation is that the heterogeneity is largely random in origin.
TABLE 4:
R MATRIX
| |
Armenian Uromia 1 |
Armenian Tabriz 2 |
Armenian Tehran 3 |
Armenian Isfahan 4 |
Assyrian Tehran 5 |
Assyrian Uromia 6 |
|
1 |
0.0161 |
... |
... |
... |
... |
... |
|
2 |
-0.0032 |
0.0094 |
... |
... |
... |
... |
|
3 |
-0.0045 | -0.0015 |
0.0113 |
... |
... |
... |
|
4 |
-0.0032 | -0.0037 |
0.0030 |
0.0099 |
... |
... |
|
5 |
-0.0069 | -0.0001 | -0.0031 | -0.0034 |
0.0151 |
... |
|
6 |
0.0018 |
-0.0009 | -0.0051 | -0.0027 | -0.0016 |
0.0086 |
NOTE: RST = 0.011718.
DISCUSSION
A few blood group data on Armenians and Assyrians are available from other studies in Iran and neighboring countries. A comparison with the present re sults confirms that the Armenians and Assyrians as a whole are characterized by a high A gene and cde haplotype frequency [12]. .
Table 5
DISTANCE MATRIX 2ij = ri + rjj û 2rij
| |
Armenian Uromia 1 |
Armenian Tabriz 2 |
Armenian Tehran 3 |
Armenian Isfahan 4 |
Assyrian Tehran 5 |
Assyrian Uromia 6 |
|
1 |
0.0000 |
... |
... |
... |
... |
... |
|
2 |
0.0318 |
0.0000 |
... |
... |
... |
... |
|
3 |
0.0364 |
0.0237 |
0.0000 |
.. |
... |
... |
|
4 |
0.0324 |
0.0266 |
0.0151 |
0.0000 |
... |
... |
|
5 |
0.0450 |
0.0247 |
0.0326 |
0.0319 |
0.0000 |
... |
|
6 |
0.0210 |
0.0198 |
0.0301 |
0.0239 |
0.0268 |
0.0000 |
1 - Armenian Uromia 2 - Armedian Tabriz 3 - Armenian Tehran
4 - Armenian Isfahan 5 - Assyrian Tehran 6 - Assyrian Uromia
Fig. 2.--The locations of the six populations on the genetic map and the extent to which each allele contributes to them.
The small size of each local sample implies fairly large errors attaching to the gene frequency estimates, which must to some extent obscure the relationships among the group. However, the first two eigenvalues of the R matrix account for 63% (35% and 28%) of the total variation so an attempt at interpretation appears reasonable.
The extent of genetic variation among the different regional groups of Armenians and Assyrians and between the two Christian groups is well demonstrated by the range of gene frequencies in almost all the genetic systems here studied, in several of which, although they are not massive, these differences attain statistical significance. The differences between the rural and urban populations of Uromia and Tehran are distinct in both the Assyrians and the Armenians and contribute appreciably to this heterogeneity, but while the two Uromia groups are quite close to each other and the two Tehran groups are less so, the heterogeneity that is observed suggests a cluster of genetically similar but slowly diversifying populations and that in this diversification process the effect of urbanization in Tehran, and concomitant gene flow or possible differential selection, contributes appreciably. The systems in which this diversification is particularly apparent are Rhesus, S, ESD, PGM1 AK, and AP.
In Iran there are as yet no data available on genetic differentiation and genetic distance, against which these estimates for the Christian population can be compared. The FST estimates vary from locus to locus, but the mean, like the estimate of RST, indicates modest but definite differentiation in blood polymorphisms. The level is similar to that found in interstate and intrastate subpopulation comparisons in India [13], less than in the ethnically diverse populations of South Africa [11], South American Indians [14, 151, and the Papago Indians [16], but considerably higher, by factors of some 3-6, than among subpopulations of Cumbria in north-west England [17]. The estimates are very unusual, however, in that the FST figures are so much lower than the FIS. One possible explanation is active migration between the communities, restraining the differentiation process, and it is unfortunate that data on migration were not collected during this survey to quantify the effect of marital interchange.
CONCLUSION
Until such time as migration, isolation by distance, and larger samples for gene frequency estimation are studied explicitly, the conclusion must remain tentative. But the impression left by the work so far is of a cluster of genetically similar but slowly diversifying populations and that in this diversification process the effect of urbanization in Tehran, and concomitant gene flow or possible differential selection, contributes appreciably.
REFERENCES
l. NIJENHUIS LE: Blood group frequencies in Iran. Vox Sang 9:723-740, 1964
2. BOWMAN JE, WALKER DG: Virtual absence of glutathione instability of the erythrocytes among Armenians in Iran. Nature 191:221-222, 1961
3. TABATABAEE H: Comparative genetic investigation of the Iranian Armenians and Jews. M.Sc. thesis, University of Tehran, 1977
4. HARRIS H, HOPKINSON DA: Handbook of Enzyme Electrophoresis in Human Genetics. Amsterdam, North-Holland, 1976
5. PAPIHA SS, BERNAL JE, MEHROTRA M: Genetic polymorphisms of serum proteins and levels of immunoglobulin and complement components in a high caste community (Brahmin) of Madhya Pradesh, India. Jpn J Hum Genet 25:1-8, 1980
6. KIRK RL, KEATS B, BLAKE NM, ET AL.: Genes and people in the Caspian littoral: a population genetic study in northern Iran. Am J Phys Anthropol 46:377-390, 1977 7. BAJATZADEH M, WALTER H: Serum protein polymorphisms in Iran. Humangenetik 6:40-54, 1982
8. FARHUD DD, WALTER H: Polymorphism of C'3 in German, Bulgarian, Iranian and Angola populations. Humangenetik 17:161-164, 1973
9. WRIGHT S: Isolation by distance. Genetics 28:116-138, 1943
10. WRIGHT S: The interpretation of population structure by F-statistics with special regard to systems of mating. Evolution 19:395-420, 1965
11. HARPENDING HC, JENKINS T: Genetic distance among South African populations, in Methods and Theories of Anthropological Genetics, edited by CRAWFORD MH, WORKMAN PL, Albuquerque, Univ. of New Mexico Press, 1973, pp 177-199
12. IKIN EW, MOURANT AE, LEHMANN H: The blood groups and haemoglobins of the Assyrians of Iraq. Man 65:110-111, 1965
13. PAPIHA SS, MUKERJEE BN, CHAHAL SMS, MALHOTRA KC, ROBERTS DF: Genetic heterogeneity and population structure in northwest India. Ann Hum Biol 9:235251, 1982
14. GERSHOWITS H, NEEL JV: The immunoglobulin allotypes (Gm and Km) of twelve Indian tribes of Central and South America. Am J Phys Anthropol 49:289-302, 1978
15. SALZANO FM: Interpopulation variability in polymorphic systems, in The Role of Natural Selection in Human Evolution, edited by SALZANo FM, New York, American Elsevier, 1975, pp 217-220
16. WORKMAN PL, HARPENDING H, LALOUEL JM, LYNCH C, NISWANDER JD, SINGLETON R: Population studies in southwestern Indian tribes: VI. Papago population structure, a comparison of genetic and migration analyses, in Genetic Structure of Populations, edited by MORTON NE, Honolulu, Univ. of Hawaii Press, 1973, pp 166-194
17. ROBERTS DF, JORDE LJ, MITCHELL RJ: Genetic structure in Cumbria. J Biosoc Sci 13:317-336, 1981
1 Department of Human Genetics, University of Newcastle upon Tyne, England.
2 Department of Human Genetics, University of Newcastle upon Tyne, England.
3 Department of Human Genetics, University of Newcastle upon Tyne, England.
4 School of Public Health, University of Tehran, Iran.